1018 User Guide: Difference between revisions
No edit summary |
No edit summary |
||
| Line 65: | Line 65: | ||
{{UGC-End}} | {{UGC-End}} | ||
{{UG-Part3}} | |||
If you want to know more about the | == Part 4: Advanced Topics and Troubleshooting == | ||
{{UGC-Start}} | |||
{{UGC-Addressing}} | |||
{{UGC-Graphing}} | |||
{{UGC-DataInterval}} | |||
{{UGC-Entry|Analog Inputs|| | |||
If you want to know more about the capabilities of the analog inputs on this device, check the [[Analog Input Primer]]. | |||
}} | |||
{{UGC-Entry|Digital Inputs|| | |||
If you want to know more about the capabilities of the digital inputs on this device, check the [[Digital Input Primer]]. | |||
}} | |||
{{UGC-Entry|Digital Outputs|| | |||
If you want to know more about the capabilities of the digital outputs on this device, check the [[InterfaceKit Digital Outputs]]. | |||
}} | |||
{{ | {{UGC-End}} | ||
Revision as of 18:15, 10 March 2021
Getting Started
Welcome to the 1018 user guide! In order to get started, make sure you have the following hardware on hand:
- 1018 Phidget InterfaceKit
- USB cable and computer
- something to use with the 1018 (e.g. LEDs, switches, analog sensors, etc)
Next, you will need to connect the pieces:
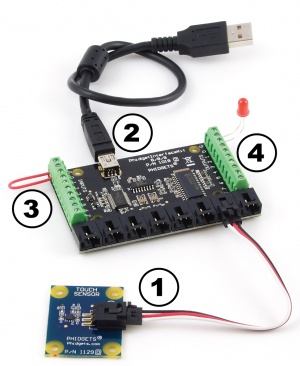
- Connect any sensors to the voltage inputs on the 1018.
- Connect the 1018 InterfaceKit to the computer using a USB cable.
- Connect a switch or a piece of wire connecting ground to one of the digital input terminals.
- Connect an LED to one of the Digital Outputs by inserting the long LED wire into the digital output 0 and the shorter wire into Ground.
Now that you have everything together, let's start using the 1018!
Part 2: Using Your Phidget
About
The 1018 PhidgetInterfaceKit 8/8/8 has:
- 8 Digital Inputs for reading switches or logic-level sensors
- 8 Digital Outputs for LEDs or simple logic-level output
- 8 Analog Inputs for reading 0-5V sensors
Each analog port can be opened as a VoltageInput or a VoltageRatioInput object, depending on what kind of sensor you're connecting to.
Explore Your Phidget Channels Using The Control Panel
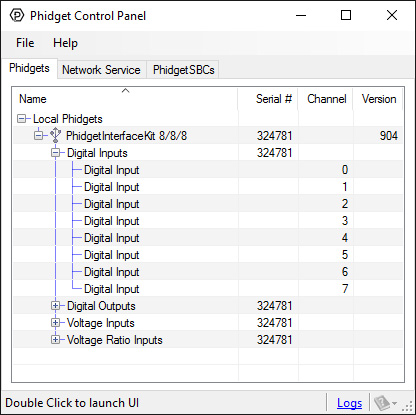
You can use your Control Panel to explore your Phidget's channels.
1. Open your Control Panel, and you will find the following channels:
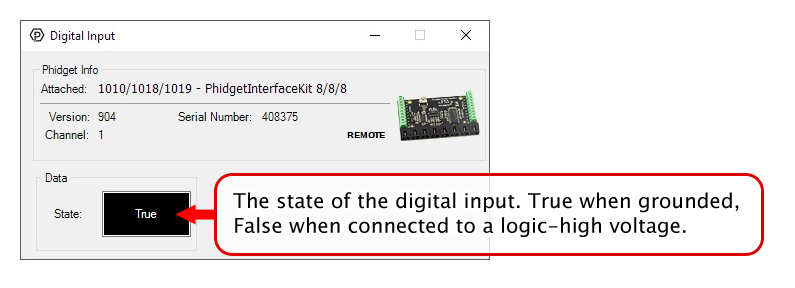
2. Double click on a channel to open an example program. Each channel belongs to the Digital Input, Digital Output, Voltage Input or Voltage Ratio Input channel class:
In your Control Panel, double click on "Digital Input":
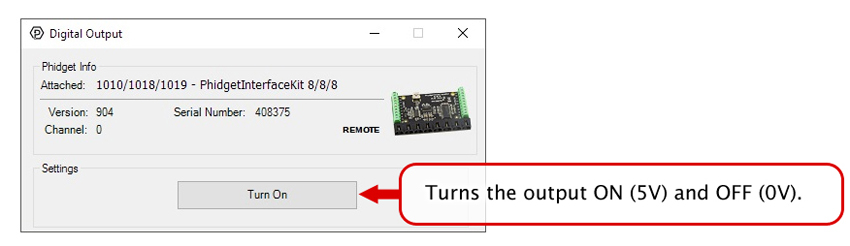
In your Control Panel, double click on "Digital Output":
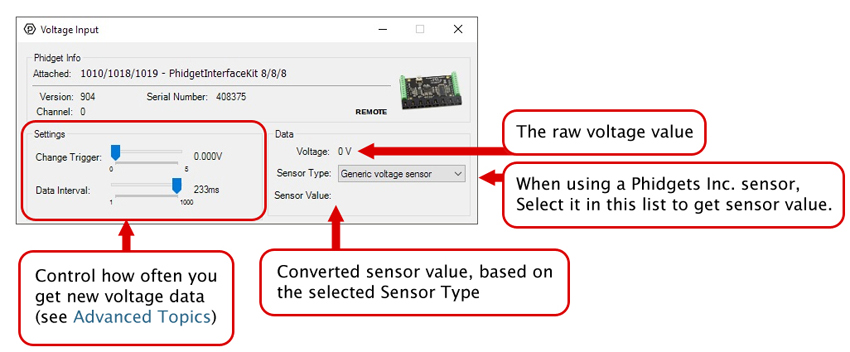
In your Control Panel, double click on "Voltage Input":
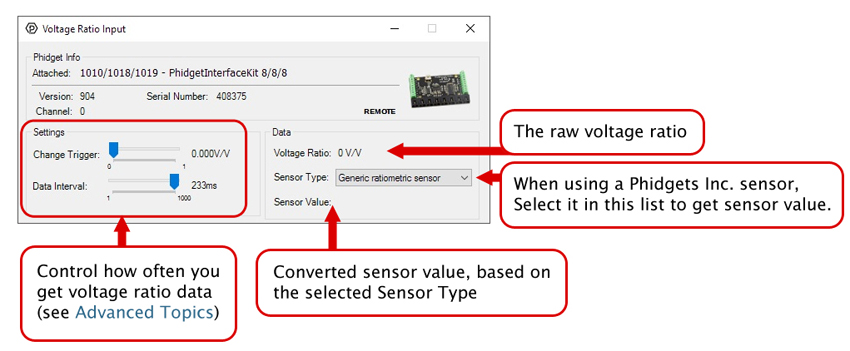
In your Control Panel, double click on "Voltage Ratio Input":
Part 3: Create your Program
Part 4: Advanced Topics and Troubleshooting
Before you open a Phidget channel in your program, you can set these properties to specify which channel to open. You can find this information through the Control Panel.
1. Open the Control Panel and double-click on the red map pin icon:

2. The Addressing Information window will open. Here you will find all the information you need to address your Phidget in your program.

See the Phidget22 API for your language to determine exact syntax for each property.
Note: Graphing and logging is currently only supported in the Windows version of the Phidget Control Panel.
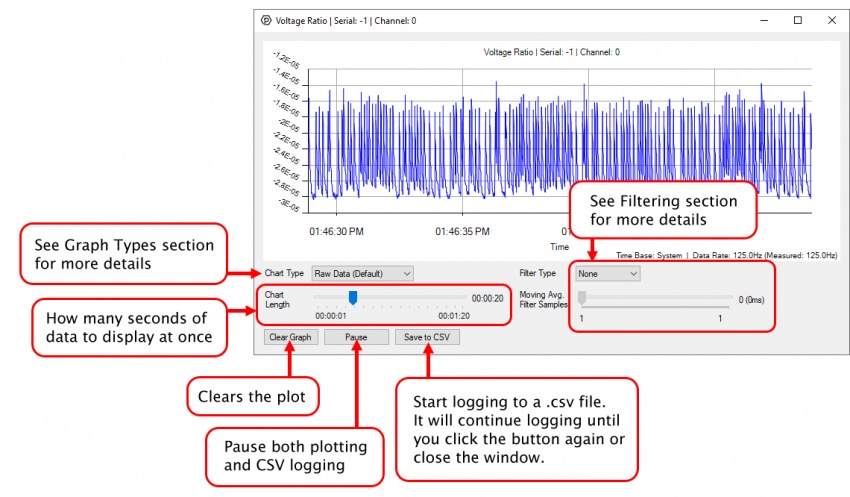
In the Phidget Control Panel, open the channel for your device and click on the ![]() icon next to the data type that you want to plot. This will open up a new window:
icon next to the data type that you want to plot. This will open up a new window:
If you need more complex functionality such as logging multiple sensors to the same sheet or performing calculations on the data, you'll need to write your own program. Generally this will involve addressing the correct channel, opening it, and then creating an Event Handler and adding graphing/logging code to it.
The quickest way to get started is to download some sample code for your desired programming language and then search google for logging or plotting in that language (e.g. "how to log to csv in python") and add the code to the existing change handler.
Filtering
You can perform filtering on the raw data in order to reduce noise in your graph. For more information, see the Control Panel Graphing page.
Graph Type
You can perform a transform on the incoming data to get different graph types that may provide insights into your sensor data. For more information on how to use these graph types, see the Control Panel Graphing page.
The Change Trigger is the minimum change in the sensor data needed to trigger a new data event.
The Data Interval is the time (in ms) between data events sent out from your Phidget.
The Data Rate is the reciprocal of Data Interval (measured in Hz), and setting it will set the reciprocal value for Data Interval and vice-versa.
You can modify one or both of these values to achieve different data outputs. You can learn more about these properties here.
If you want to know more about the capabilities of the analog inputs on this device, check the Analog Input Primer.
If you want to know more about the capabilities of the digital inputs on this device, check the Digital Input Primer.
If you want to know more about the capabilities of the digital outputs on this device, check the InterfaceKit Digital Outputs.