Prerequisites
This project assumes you are familiar with the following
Setup
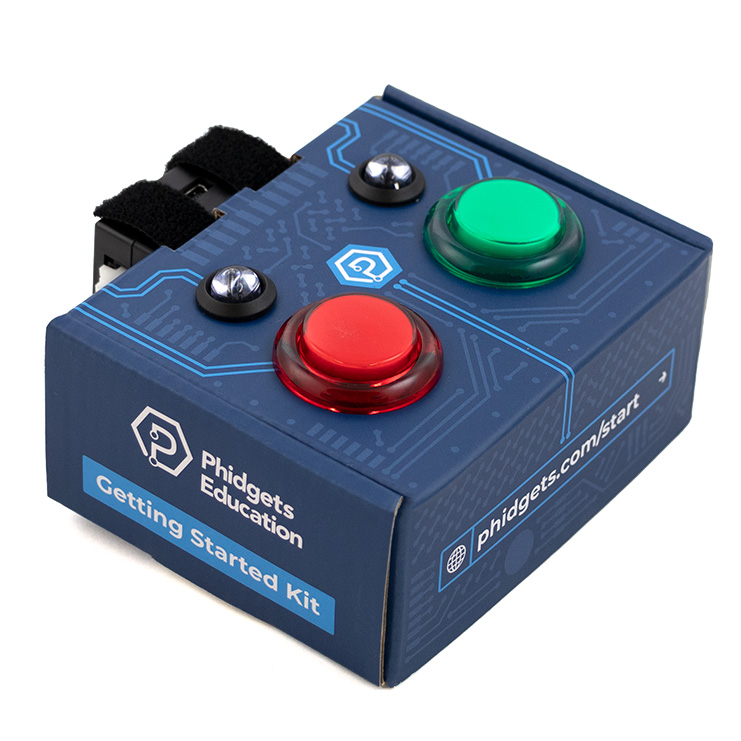
All you need for this project is the Getting Started Kit.
Install Plotly
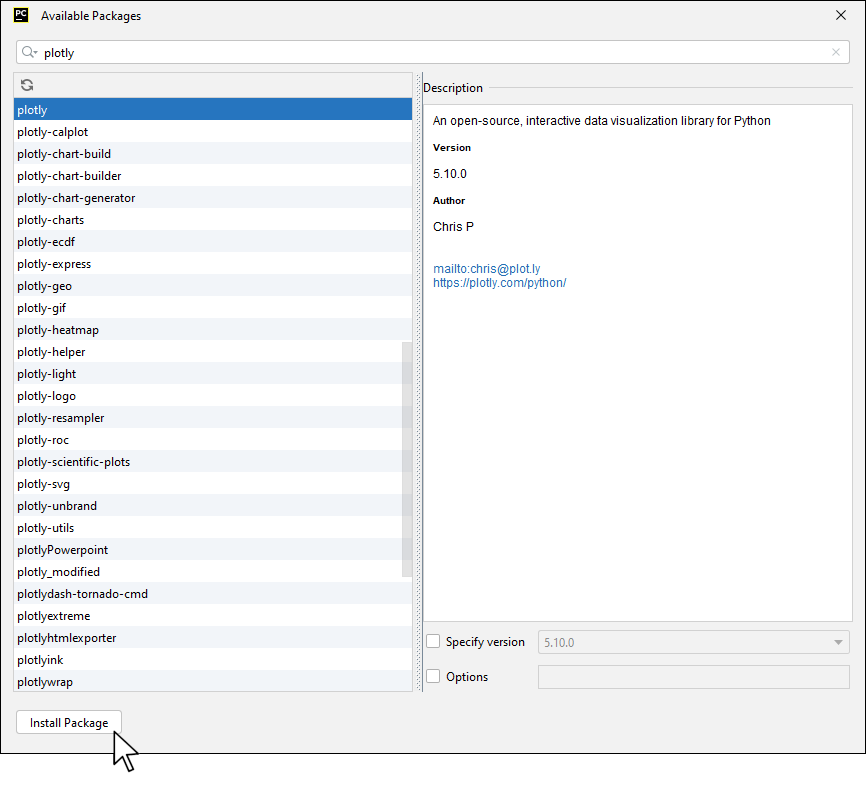
In order to use Plotly, you first have to install it. You do this in the same way you previously installed the Phidget22 library. Simply navigate to your package manager, search for plotly and press install!
Thonny
If you're using Thonny, select Tools > Manage Packages and search for plotly.

PyCharm
If you're using PyCharm, select File > Settings > Python Interpreter and use the + symbol to install plotly.
PyScripter
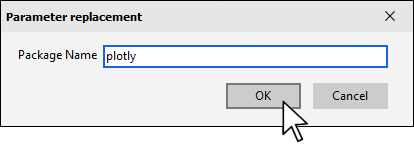
If you're using PyScripter, select Tools > Tools > Install Packages with pip and enter plotly.
Write code (Python)
Copy the code below into a new Python project. If you need a reminder of how to do this, revisit the Getting Started Course.
Not your programming language? Set your preferences so we can display relevant code examples
#Add Phidgets library
from Phidget22.Phidget import *
from Phidget22.Devices.TemperatureSensor import *
#Required for sleep statement
import time
#Required to plotly
import plotly.express as px

#Create
temperatureList = []
temperatureSensor = TemperatureSensor()

#Open
temperatureSensor.openWaitForAttachment(1000)

#Set data interval to minimum | This will increase the data rate from the sensor.
temperatureSensor.setDataInterval(temperatureSensor.getMinDataInterval())

#Use Your Phidgets to Collect Data
for i in range (10):
    temperatureList.append(temperatureSensor.getTemperature())
    print(temperatureList[i])
    #Sleep until new data is available. Divide by 1000 to convert from ms to seconds.
    time.sleep(temperatureSensor.getDataInterval()/1000)

#Use plotly to visualize data
fig = px.scatter(y=temperatureList)
fig.show()
Run Your Program
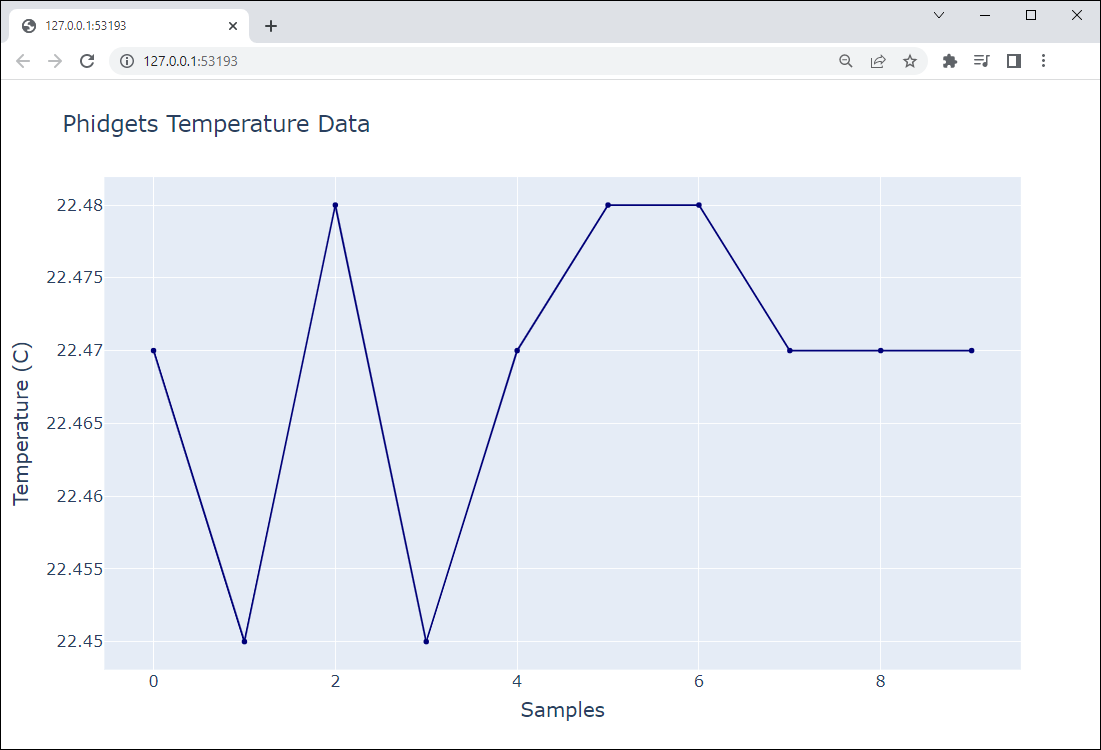
Your program will capture 10 temperature samples and display a plot.
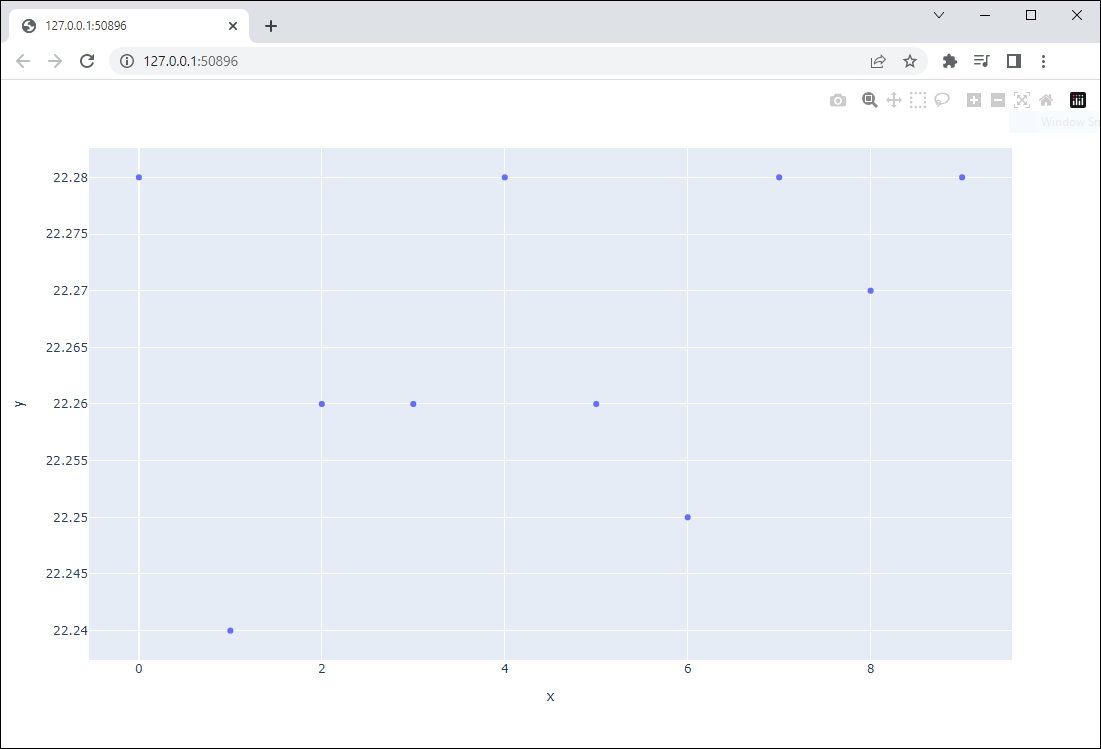
Practice
- View the Plotly Documentation and customize the appearance of your plot. Try to create a plot that looks like the one below: