Setup
Before getting started, make sure you have the following parts.

Step 1
Simply connect your Getting Started Kit to your Raspberry Pi. Note: make sure your Humidity Phidget is connected (not shown in image).
If you haven't set up your Raspberry Pi with Phidgets yet, visit this project.

Review
In the previous two projects, you did the following:
- Installed a web server on your Raspberry Pi and modified your website.
- Created a Python script that logged data to a file and then displayed that data on your website.
If you have not completed the previous projects, check them out now: Project 1, Project 2
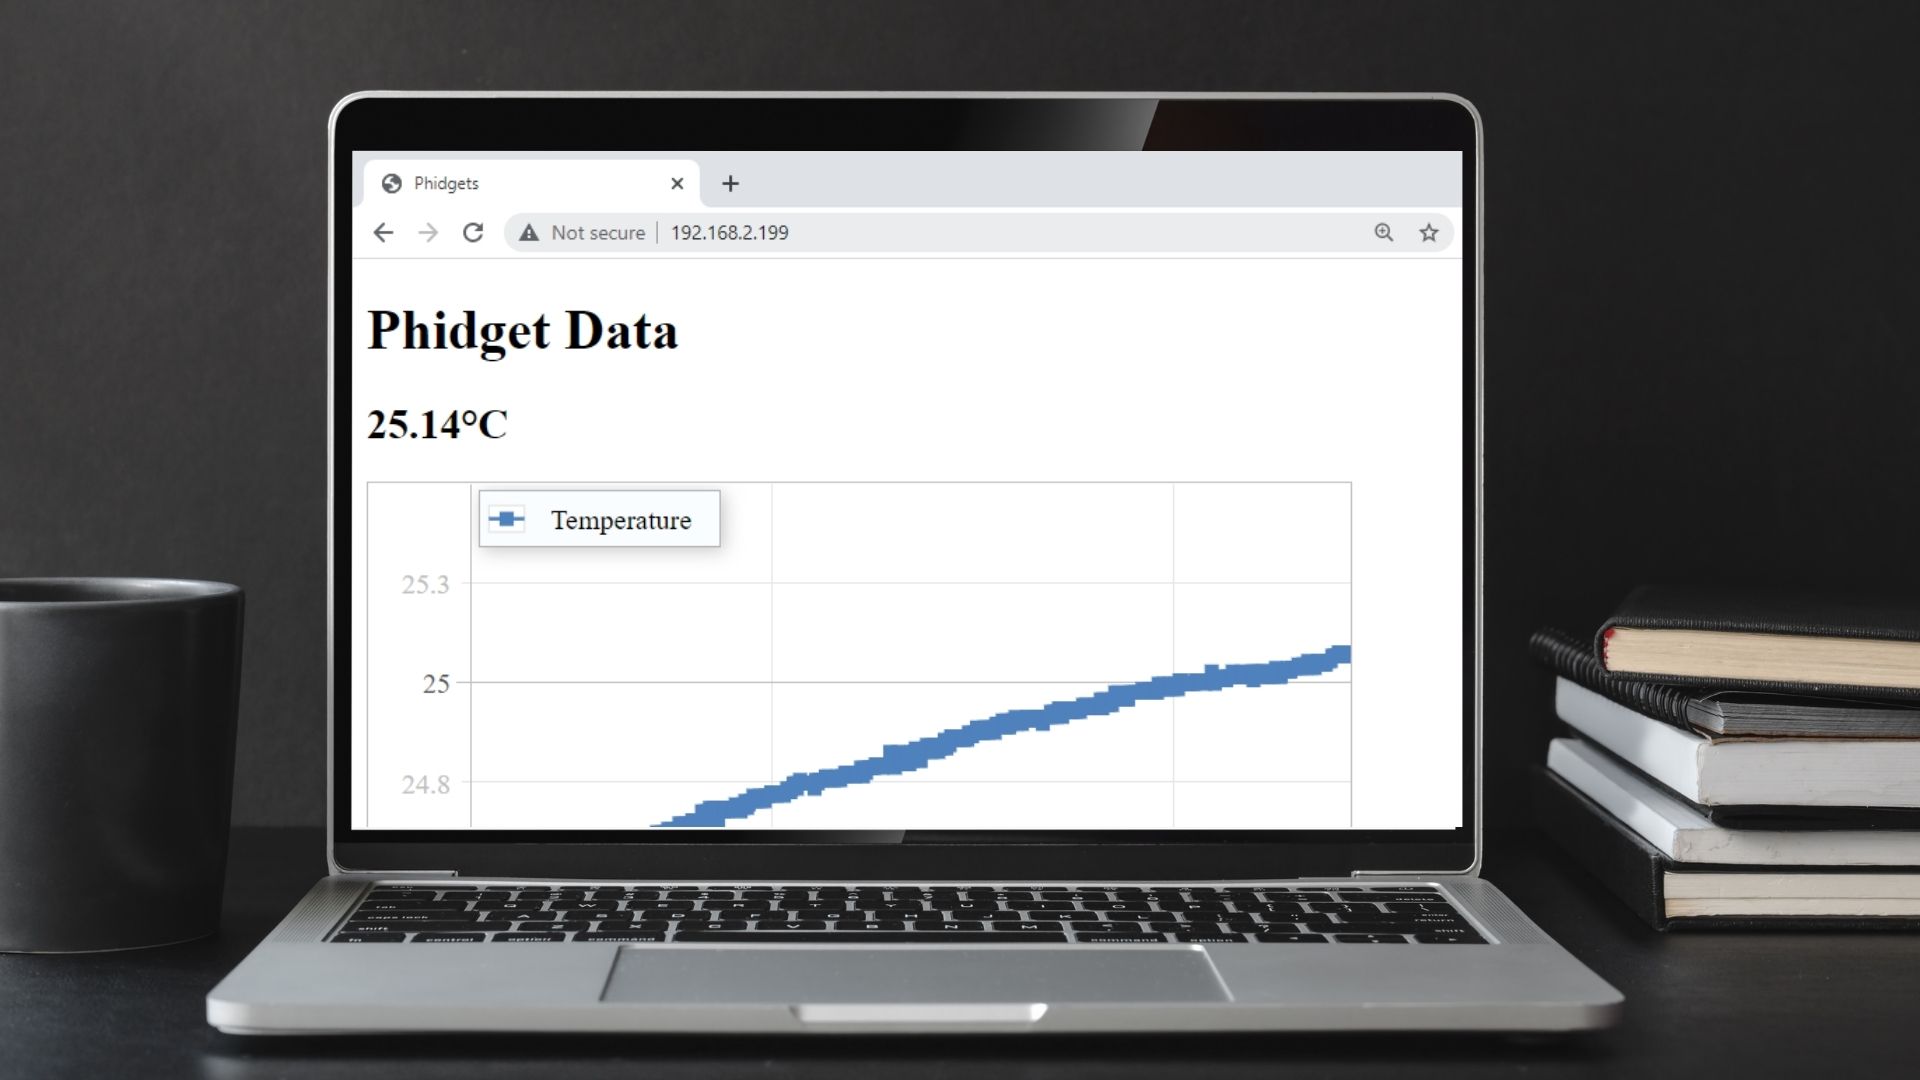
Creating a Graph for Your Website
In the previous project, you logged sensor data to a CSV file. You can now use a graphing library to display the contents of that file on your website. There are many options available online, but for this project, plotly will be used.
Modify Your Website
Overwrite your index.html file with the following:
<!doctype html>
<html lang="en">
    <head>
        <meta charset="utf-8">
        <script src='https://cdn.plot.ly/plotly-2.14.0.min.js'></script>
        <title>Phidgets</title>
    </head>
    <script>

        //This is where you will store your temperature data
        var temperature_trace = {
            x: [],
            y: [],
            mode: 'lines+markers'
        };

        function connectPhidgets(){
            temperature_trace.x = [] //reset data
            temperature_trace.y = [] //reset data
            temperatureData = 0 //reset data
            fetch('data.csv')
                .then(response => response.text())
                .then(text => {
                    let data = text.split("\n");
                    //Get Data
                    for (let i = 1; i < data.length - 1; i += 1) {
                        temperatureData = data[i].split(",");
                        temperature_trace.y.push(temperatureData[0]) //If you have multiple columns, use [1],[2], etc. to access them
                        temperature_trace.x.push(i)
                    }
                    document.getElementById("dataLabel").innerHTML = temperatureData[0] + "°C"; //display last data point

                    //Plot data
                    var plotly_data = [temperature_trace];
                    var layout = {
                        title: 'Temperature Data',
                        xaxis: {
                            title: 'Num Points'
                        },
                        yaxis: {
                            title: 'Degrees Celsius'
                        }
                    };
                    Plotly.newPlot('dataGraph', plotly_data, layout);
                 })
        }
    </script>
    <body onload="connectPhidgets()">
        <div>
            <h1>Phidget Data</h1>
            <h2 id="dataLabel">?</h2>
            <div id="dataGraph">
        </div>
    </body>
</html>
Practice
- Try logging the current time to your data.csv file along with the current temperature. Use this as the x-axis for your graph.