Prerequisites
- This project assumes you have a basic understanding of GUIs with C# and Visual Studio. If you do not, we recommend reviewing a tutorial from Microsoft such as Create a Windows Forms app in Visual Studio with C# or numerous video tutorials online.
- This project assumes you have completed the Getting Started Kit Advanced Lessons on events.
Setup
All you need for this project is the Getting Started Kit.

Create Project
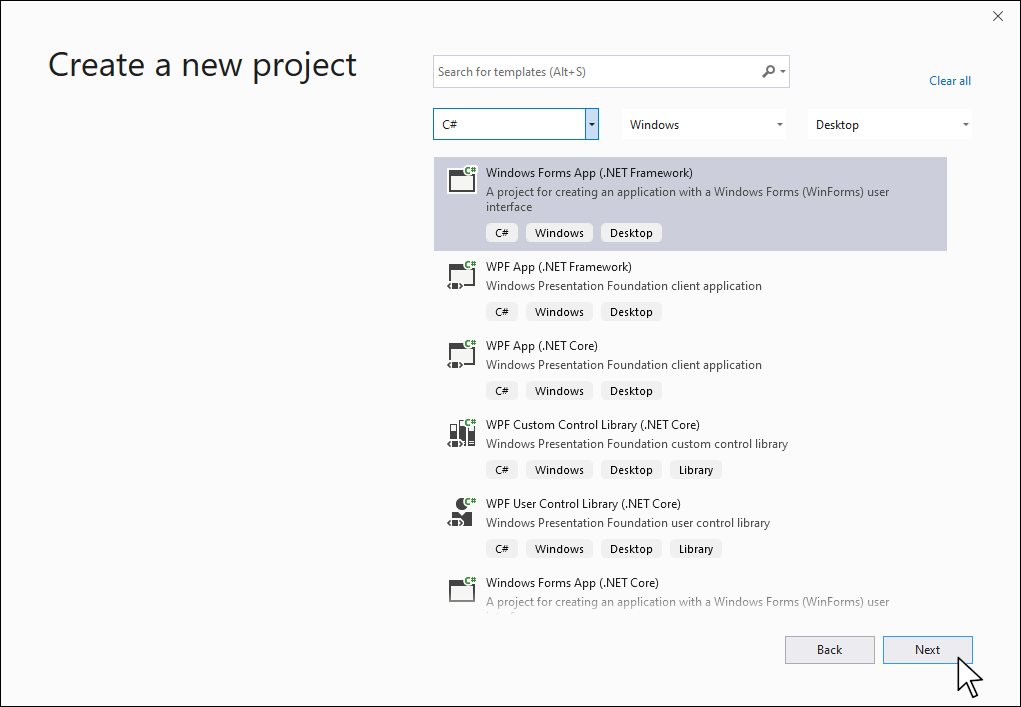
Step 1
Open Visual Studio and create a new Windows Form App (.NET Framework).
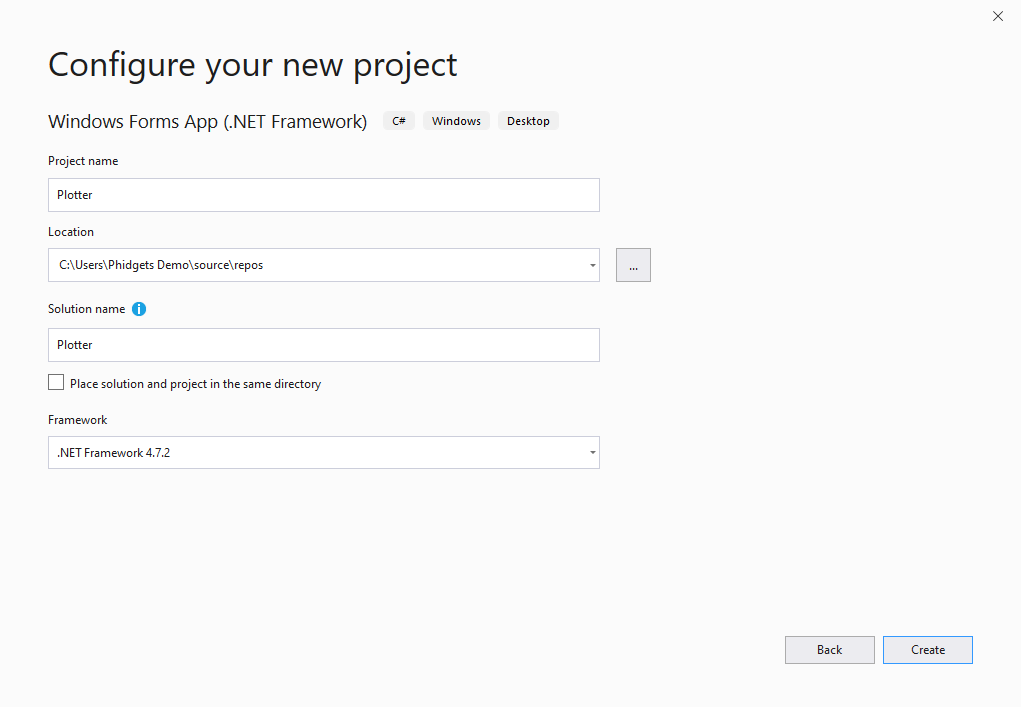
Step 2
Name the project Plotter and place it in the location of your choice
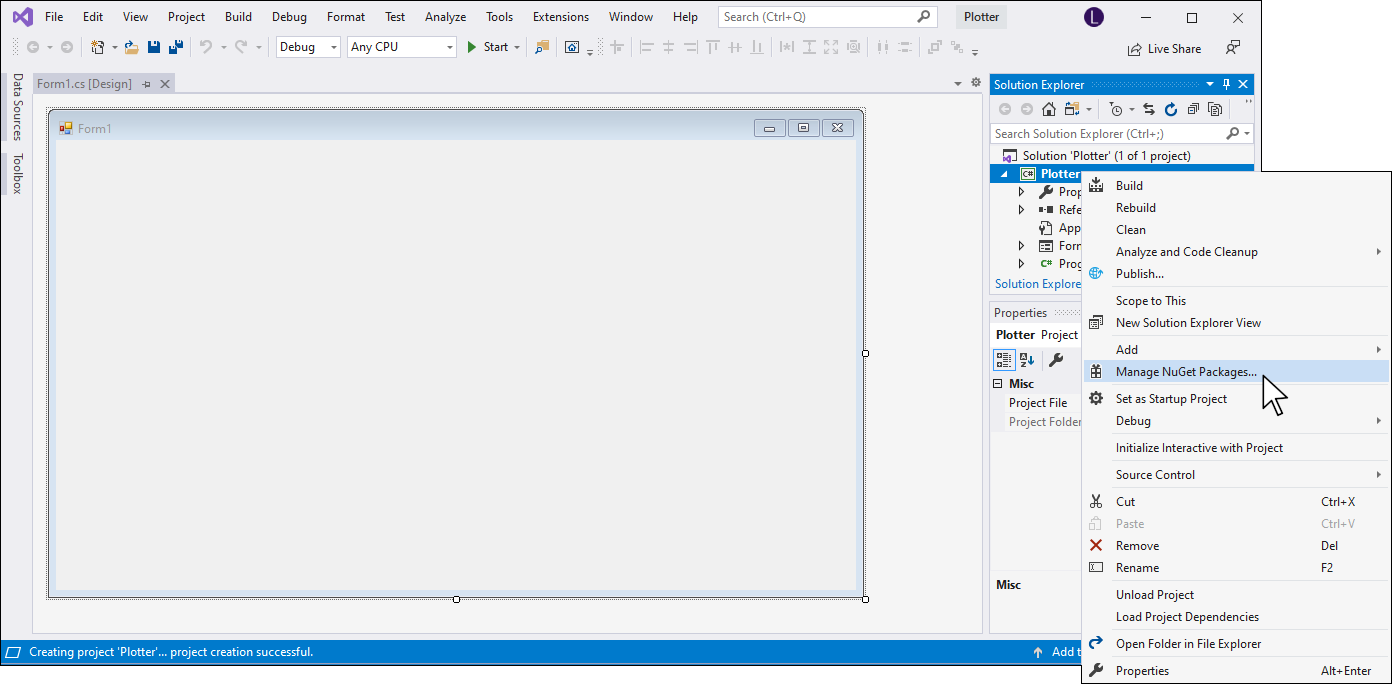
Step 3
Right-click on your project and select Manage NuGet Packages…
Step 4
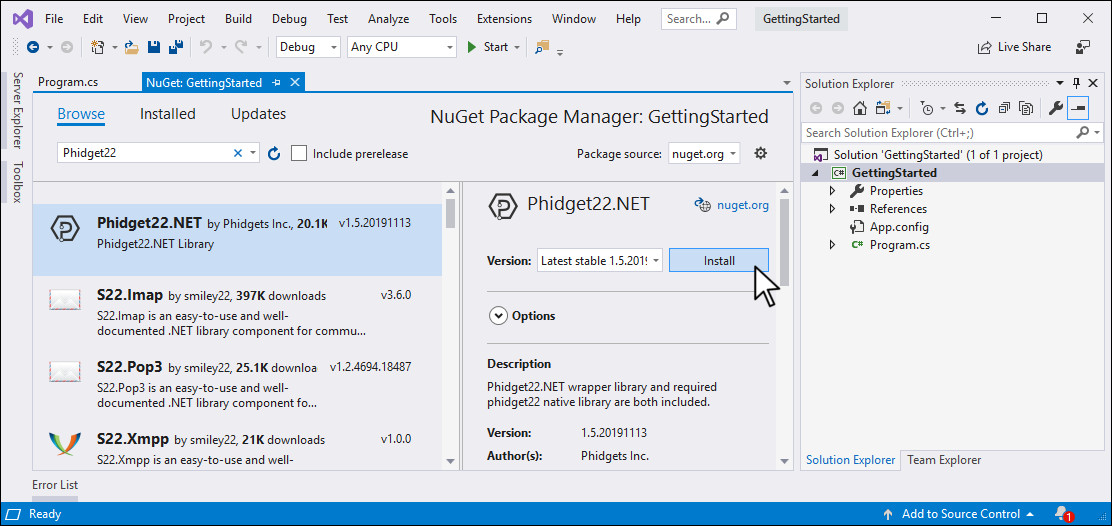
Click on the Browse button in the top left corner and enter Phidget22 in the search bar. Click on the package and install the latest version.
Step 5
Drag a Chart object onto your form.
Step 6
Generate the Form Load event by double-clicking on your form.
Step 7
Rewrite the code below into your Form1.cs file. Hover over the comments below for more information about specific sections of the code.
using System;
using System.Drawing;
using System.Windows.Forms;
using Phidget22;

namespace Plotter
{
    public partial class Form1 : Form
    {
        //Define | Define object here so it can be used throughout program
        TemperatureSensor temperature;

        public Form1()
        {
            InitializeComponent();
        }

        private void Form1_Load(object sender, EventArgs e)
        {
            //Configure chart
            chart1.Series.Clear(); //remove default series
            chart1.Series.Add("Temperature"); //add series called Temperature
            chart1.Series.FindByName("Temperature").ChartType = System.Windows.Forms.DataVisualization.Charting.SeriesChartType.Line; //Change chart type to line
            chart1.Series.FindByName("Temperature").Color = Color.Red; //Change series color to red

            //Create
            temperature = new TemperatureSensor();

            //Add event
            temperature.TemperatureChange += Temperature_TemperatureChange;

            //Open | Use open without a timeout value because GUIs are event driven and we do not want to wait on main thread.
            temperature.Open();
        }

        private void Temperature_TemperatureChange(object sender, Phidget22.Events.TemperatureSensorTemperatureChangeEventArgs e)
        {
            //Add data point to series
            chart1.Series.FindByName("Temperature").Points.Add(e.Temperature);
        }
    }
}
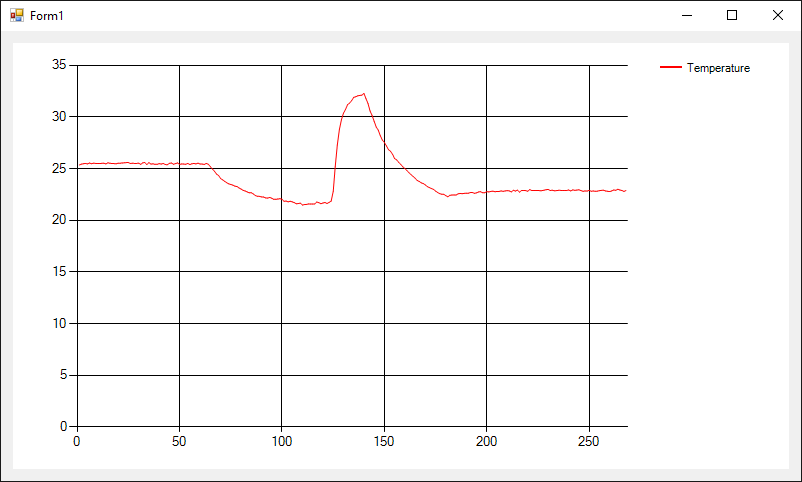
Run Your Code
Try warming up your Humidity Phidget by holding it in your hands. You will see the graph value increase.
Practice
- Create a label on your form that displays the current temperature.
- Try adding a new series that displays the humidity on a line graph. Create a label on your form that displays the current humidity.
- Try adding functionality to your graph. For example, you could add a button that resets the graph or a slider that modifies the data interval of the Humidity Phidget.